cardiac cycle
Wiggers diagram
ECG
heart sounds
JVP waves
physiology
NEET PG 2026
Master cardiac cycle, Wiggers diagram, ECG basis, heart sounds, preload-afterload, Starling's law, JVP waves, and CO measurement for NEET PG 2026 — high-yield MCQ traps.
Cardiovascular physiology is a top-five NEET PG topic — expect 4 to 6 questions per paper across Physiology, Medicine, and Anaesthesia. Lock these:
Cardiovascular physiology is the densest NEET PG block of pure concept-based questions because Wiggers, ECG vector analysis, and the JVP-PCWP coupling reward students who genuinely understand the cycle rather than just memorise tables. Examiners reach for it because each component — pressure-volume loops, JVP waves, heart sounds — has clean, exam-friendly clinical correlates.
This NEETPGAI deep dive walks through every phase of the cardiac cycle, the Wiggers diagram, ECG generation, heart sounds and murmurs, preload-afterload-contractility, Starling's law, neural and humoral regulation, and cardiac output measurement. Pair this guide with the arrhythmia management deep dive and the heart failure guide for a complete circulatory map.
At resting heart rate 75 beats per minute, each cycle is 0.8 seconds long — systole 0.3 s, diastole 0.5 s. Tachycardia shortens diastole disproportionately, which is why coronary perfusion (diastolic event) suffers most.
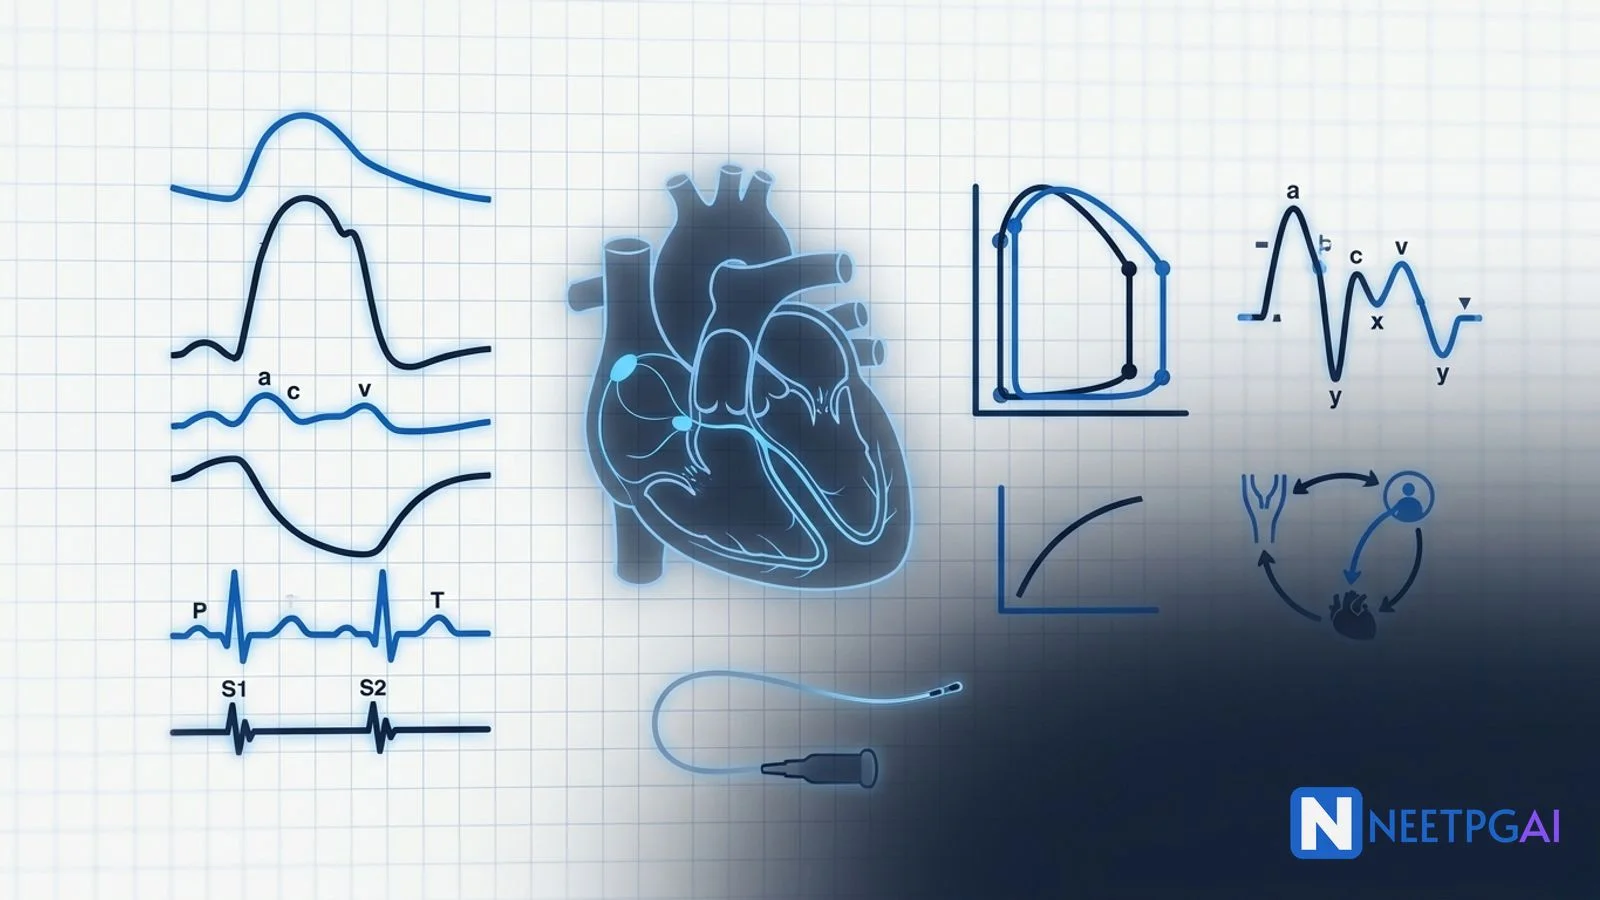
Atrial depolarisation (P wave) precedes contraction. Atria contribute 20 to 30 percent of ventricular end-diastolic volume — the "atrial kick", crucial in stiff ventricles (HFpEF, atrial fibrillation loses it).
Pressure events — small rise in atrial pressure (a wave on JVP) and ventricular pressure.
S4 if audible (always pathological in adults) — caused by atrial contraction against a stiff ventricle.
Ventricular depolarisation completes (QRS), ventricular pressure rises sharply, AV valves snap shut producing S1 (M1 then T1). All valves are closed; volume does not change while pressure climbs steeply.
Pressure events — c wave on JVP (tricuspid bulge into RA).
Start practicing NEET PG MCQs with AI-powered explanations.
Start Free PracticeMaster GI secretions, digestion, absorption transporters, motility patterns, and gut hormones with high-yield NEET PG 2026 traps and India-context examples.
Master labor stages, Friedman vs Zhang curves, WHO partograph, AMTSL, episiotomy and India JSY/LaQshya policies for NEET PG 2026 OBG MCQs.
5 anterior segment ophthalmology image MCQs for NEET PG: hypopyon and Behcet, Kayser-Fleischer ring in Wilson, Brushfield spots in Down, corneal arcus, and pterygium vs pinguecula.
Daily MCQs, study tips, and topper strategies on Telegram.
Join on Telegram →Ventricular pressure exceeds aortic/pulmonary pressure; semilunar valves open; about 70 percent of stroke volume ejected in this phase. Aortic pressure peaks.
ECG — between QRS and T.
Ventricular contraction wanes; ejection slows; ventricular and aortic pressures fall together. Repolarisation (T wave) starts.
Ventricular pressure falls below aortic/pulmonary pressure; semilunar valves close producing S2 with physiological splitting (A2 then P2 on inspiration). AV valves still closed; volume unchanged. End-systolic volume reaches its minimum.
Pressure events — incisura (dicrotic notch) on aortic pressure trace from aortic valve closure; v wave peak on JVP.
Atrial pressure exceeds ventricular pressure; AV valves open with a y descent on JVP; blood rushes into the ventricle. If S3 is audible, it occurs here (physiological in young, pathological in volume overload or HFrEF in adults).
Ventricular filling slows as ventricle and atrium pressures equalise. This phase shortens most with tachycardia.
The Wiggers diagram stacks (top to bottom) — aortic, ventricular, atrial pressures; ventricular volume; ECG; phonocardiogram (S1, S2, S3, S4); JVP waves. NEET PG questions often ask which event corresponds to which deflection. Anchor points:
Plot ventricular pressure (Y axis) against ventricular volume (X axis). A complete cycle traces a counter-clockwise rectangular loop.
Stroke volume = LVEDV minus LVESV (width of the loop).
Ejection fraction = SV / LVEDV (normal 55 to 70 percent).
Area within the loop = external stroke work.
End-systolic pressure-volume relationship (ESPVR) = contractility (steeper slope means stronger contraction).
End-diastolic pressure-volume relationship (EDPVR) = compliance (steeper means stiffer).
Loop changes
The ECG records the sum of all cardiac electrical activity from skin electrodes.
SA node (right atrium, rate 60-100/min, sympathetic and parasympathetic innervation) → internodal pathways → AV node (rate 40-60/min, delay 0.1 s) → bundle of His → right and left bundle branches → left anterior and posterior fascicles → Purkinje fibres (rate 20-40/min) → ventricular myocardium.
The intrinsic pacemaker hierarchy explains escape rhythms — junctional 40-60/min if SA fails, ventricular 20-40/min if both fail.
Mean QRS axis normally between -30 and +90 degrees in adults. Left axis deviation (-30 to -90) — LBBB, LVH, left anterior hemiblock, inferior MI. Right axis deviation (+90 to +180) — RVH, pulmonary embolism, COPD, left posterior hemiblock, lateral wall MI, dextrocardia.
S1 (mitral and tricuspid closure) — start of systole; loudest at apex (M1) and lower left sternal border (T1). Loud S1 in mitral stenosis (stiff valve snaps shut), short PR. Soft S1 in mitral regurgitation (incomplete closure), first-degree heart block.
S2 (aortic and pulmonary closure) — end of systole. Normal physiological splitting on inspiration (A2 then P2 — increased venous return delays right ventricular emptying and P2). Wide fixed splitting in ASD. Paradoxical splitting in LBBB and aortic stenosis (P2 precedes A2). Loud P2 in pulmonary hypertension.
S3 — early diastolic; ventricular gallop; rapid filling of a dilated/non-compliant ventricle. Physiological in children, young adults, pregnancy. Pathological after age 40 — suggests HFrEF, volume overload, mitral regurgitation. Best heard at apex with bell.
S4 — late diastolic; atrial gallop; atrial contraction against stiff ventricle. Always pathological in adults — LVH, HFpEF, hypertensive heart disease, hypertrophic cardiomyopathy, AS, ischaemia. Absent in atrial fibrillation.
| Murmur | Phase | Classic finding |
|---|---|---|
| Aortic stenosis | Mid-systolic ejection | Crescendo-decrescendo, radiates to carotids; pulsus parvus et tardus |
| Pulmonary stenosis | Mid-systolic | Left upper sternal border |
| Mitral regurgitation | Pansystolic | Apex, radiates to axilla |
| Tricuspid regurgitation | Pansystolic | Left lower sternal border, louder on inspiration (Carvallo sign) |
| Ventricular septal defect | Pansystolic | Left lower sternal border |
| Aortic regurgitation | Early diastolic | Left sternal border, leaning forward, expiration; collapsing pulse |
| Mitral stenosis | Mid-late diastolic | Apex, left lateral position, expiration; opening snap; loud S1 |
| Patent ductus arteriosus | Continuous | Machinery murmur, left infraclavicular |
Preload = end-diastolic ventricular volume (or wall stress at end-diastole). Approximated clinically by LVEDP, which itself is approximated by PCWP (pulmonary capillary wedge pressure). Increased by volume loading, venous return, supine posture; reduced by diuretics, venodilators (nitrates), haemorrhage.
Afterload = wall stress during ejection (Laplace law: T = P × r / 2h). Approximated clinically by systemic vascular resistance and aortic pressure. Increased by hypertension, aortic stenosis, vasoconstrictors; reduced by vasodilators (ACEi, hydralazine, nitroprusside).
Contractility (inotropy) = strength of contraction at a given preload and afterload. Increased by sympathetic stimulation (beta-1), circulating catecholamines, digoxin, dobutamine, milrinone, calcium; reduced by beta-blockers, calcium channel blockers, acidosis, ischaemia, hypoxia.
Within physiological limits, stroke volume rises with end-diastolic volume. Mechanism: optimal actin-myosin filament overlap at sarcomere length 2.2 micrometres maximises cross-bridge formation; longer sarcomeres also increase calcium sensitivity of troponin C.
Clinical relevance: explains how the right and left ventricles match outputs without external coordination, why volume expansion improves stroke volume in fluid-responsive shock, and why ventricular over-distension (HFrEF) drops onto the descending limb of the curve.
CO = VO2 / (CaO2 minus CvO2)
Requires VO2 (250 mL/min at rest), arterial O2 content, and mixed-venous O2 content from pulmonary artery sample. Most accurate; impractical for routine use.
Cold saline injected into the right atrium via Swan-Ganz catheter; temperature change measured downstream in the pulmonary artery. Modified Stewart-Hamilton equation calculates CO. Used in ICU.
CO = SV × HR, where SV = LVOT area × LVOT velocity-time integral (VTI). Non-invasive.
Beat-to-beat CO from arterial line waveform (FloTrac, PiCCO).
The cardiac cycle has 7 phases — atrial systole, isovolumetric ventricular contraction, rapid ejection, reduced ejection, isovolumetric ventricular relaxation, rapid filling, and slow (diastasis) filling. Systole comprises isovolumetric contraction plus ejection; diastole comprises isovolumetric relaxation plus filling plus atrial contraction. At rest, systole lasts about 0.3 s and diastole 0.5 s in a 0.8 s cycle (heart rate 75/min).
S1 is produced by closure of the mitral and tricuspid valves at the onset of ventricular systole — the M1 (mitral) component slightly precedes T1 (tricuspid). S2 is produced by closure of the aortic and pulmonary valves at the end of ventricular systole — A2 normally precedes P2, with physiological splitting on inspiration due to delayed P2 from increased venous return.
The a wave is right atrial contraction (occurs just before S1). The c wave is bulging of the closed tricuspid valve into the right atrium during isovolumetric ventricular contraction (occurs with S1). The v wave is passive right atrial filling against the closed tricuspid valve during ventricular systole (occurs around S2). The x descent follows the c wave (atrial relaxation); the y descent follows the v wave (tricuspid opening, rapid filling).
Frank-Starling's law states that within physiological limits, the stroke volume of the heart increases as the end-diastolic volume (preload) increases. The mechanism is optimal overlap of actin and myosin filaments at longer sarcomere lengths (2.2 micrometres optimal), increasing the number of cross-bridges formed. This is intrinsic to the myocardium and operates independently of neurohormonal control. It enables the left and right ventricles to maintain matched outputs.
The Fick principle states that cardiac output equals oxygen consumption (VO2) divided by the arteriovenous oxygen content difference (CaO2 minus CvO2). A patient with VO2 of 250 mL/min and an arteriovenous O2 difference of 50 mL/L has CO of 5 L/min. Mixed venous samples must come from the pulmonary artery (not the right atrium) for accuracy. Thermodilution via Swan-Ganz catheter is the modern alternative.
This content is for educational purposes for NEET PG exam preparation. It is not a substitute for professional medical advice, diagnosis, or treatment. Clinical information has been reviewed by qualified medical professionals.
Written by: NEETPGAI Editorial Team Reviewed by: Pending SME Review Last reviewed: May 2026